
Logpush Health Dashboards
We’re excited to introduce Logpush Health Dashboards, giving customers real-time visibility into the status, reliability, and performance of their Logpush jobs. Health dashboards make it easier to detect delivery issues, monitor job stability, and track performance across destinations. The dashboards are divided into two sections:
-
Upload Health: See how much data was successfully uploaded, where drops occurred, and how your jobs are performing overall. This includes data completeness, success rate, and upload volume.
-
Upload Reliability – Diagnose issues impacting stability, retries, or latency, and monitor key metrics such as retry counts, upload duration, and destination availability.
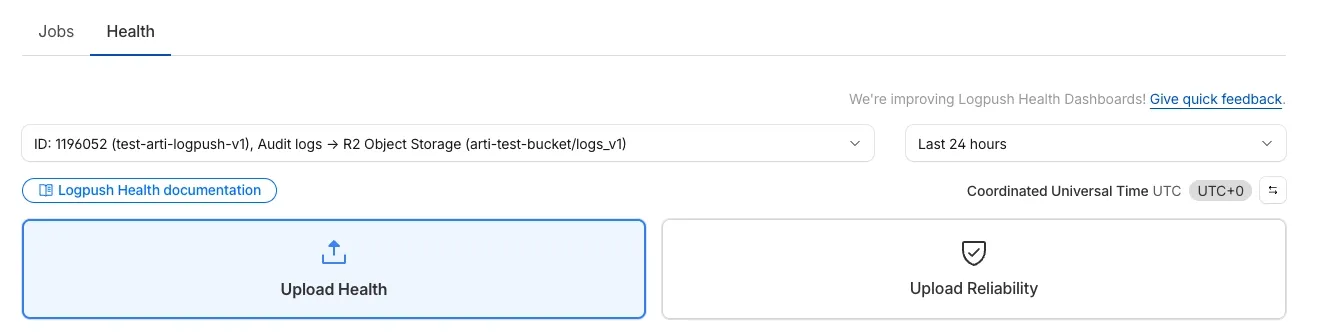
Health Dashboards can be accessed from the Logpush page in the Cloudflare dashboard at the account or zone level, under the Health tab. For more details, refer to our Logpush Health Dashboards documentation, which includes a comprehensive troubleshooting guide to help interpret and resolve common issues.
Was this helpful?
- Resources
- API
- New to Cloudflare?
- Directory
- Sponsorships
- Open Source
- Support
- Help Center
- System Status
- Compliance
- GDPR
- Company
- cloudflare.com
- Our team
- Careers
- © 2025 Cloudflare, Inc.
- Privacy Policy
- Terms of Use
- Report Security Issues
- Trademark